データ解析のための統計モデリング入門 GLMの応用範囲をひろげる 読書メモ1
2017年 04月 07日
このブログ記事は『データ解析のための統計モデリング入門』(久保拓弥 著、岩波書店)という、とても分かりやすい統計モデリングの入門書を、さらに分かりやすくするために読書メモをまとめたものです。
今回は第6章、GLMの応用範囲をひろげるについてのまとめの一回目です。
この章では様々なタイプのGLMについて説明がされています。
まずはロジスティック回帰について説明されています。
ロジスティック回帰で使われる分布は二項分布なので、いろいろなパラメータについて二項分布をプロットしてくれるコードを用意しました。
コードはRで書きました。
qs <- seq(0.1, 0.9, by = 0.2)
xl <- "y"
yl <- "Probability"
legends <- paste0("q = ", qs)
for (N in 1:20) {
  title <- paste0("Binomial distribution, p(y|N = ", N, ", q)")
  plot(0, 0, type = "n", xlim = c(0, N), ylim = c(0.0, 1.0), main = title, xlab = xl, ylab = yl)
  for (i in 1:5) {
    lines(0:N, dbinom(0:N, N, qs[i]), type = "l")
    points(0:N, dbinom(0:N, N, qs[i]), pch = i)
  }
  legend("topright", legend = legends, pch = 1:5)
}
実行するとグラフが20枚プロットされます。
例えば下図のようなグラフがプロットされます。
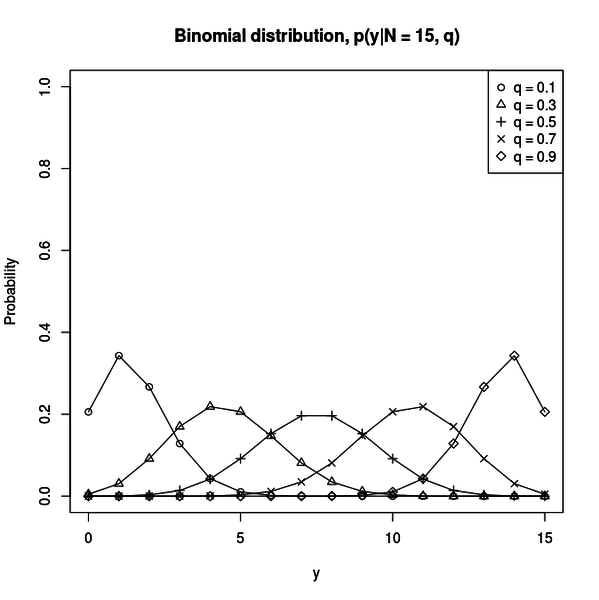
二項分布は確率 q で起きる事象が N 回中 y 回起きる確率の分布です。
この図は N = 15 の場合です。q が小さいうちは事象は少ない回数起きる確率が高く、 q が大きくなるにしたがって多くの回数起きる確率が高くなるのが分かります。

#人気の記事
#タグ